Validation of Our Pool Heating Running Cost Calculator
Article posted by Gregory Grochola (physicist) on 28th Jan 2019
The following article outlines validation comparisons between the EcoOnline solar pool heating simulator/calculator and both, the AS 3634-1989: Solar Pool Heating Standard and PoolHeat V 5.10.9 by Prof. Graham Morrison based the ISO TR 12596 1995 Standard. To have full confidence in the results and predictions produced by the simulator we have extensively tested and validated all aspects of the simulators predictions. All the below results are reproducible on the simulator/calculator.
Basic Heating Loading Equations
Governing heat load equation:
Q(T) = Ap (qe(T) + qr(T) + qc(T) - qp(T) - qs - qh(T))
where,
T = temperature of the pool (°C)
Ap = pool's water surface area (m²)
qe = rate of heat loss by evaporation (MJ/m².d)
qr = rate of heat loss by long wave radiation (MJ/m².d)
qc = rate of heat loss by conduction (MJ/m².d)
qp = rate of heat gain from solar heating (MJ/m².d)
qs = rate of heat gain from solar insolation on the pools surface (MJ/m².d)
qh = rate of heat gain from auxiliary/conventional heating (MJ/m².d)
AS 3634-1989 outlines the heat gain/loss equation as a balance between the three main heat loss mechanisms and the three main heat gain mechanisms.
To find the temperature of the pool we must solve for Q(T) = 0. This generally involves an iterative solutions as qe, qr, qc, qh and qp all have complex temperature dependence.
Note, our calculator assumes a domestic pool, hence it does not include:
- Heat losses from extensive use of a pool such as a commercial situation (generally small for a domestic pool, for a commercial pool swimmers cool a pool due to the extra splashing and evaporation - 1 swimmer per 20 m² of pool increases the evaporation rate increase by between 25% - 50% when in use)
- Make-up (top-up) water temperature difference (generally very small)
- Pools floor and side conduction losses through to the soil (these are generally small for in-ground pools, solid acts as an insulator)
Validating Predicted Pool Water Temperatures
As a first step of our validation, we compare the predicted water temperatures for an average suburban wind sheltered pool, no shading or blanket cover with light colored pool walls, across all seasons for all Australian states. Water temperatures are calculated from solar insolation, sky temperature, and weather data, representing a balance of the heat gain and loss equations.
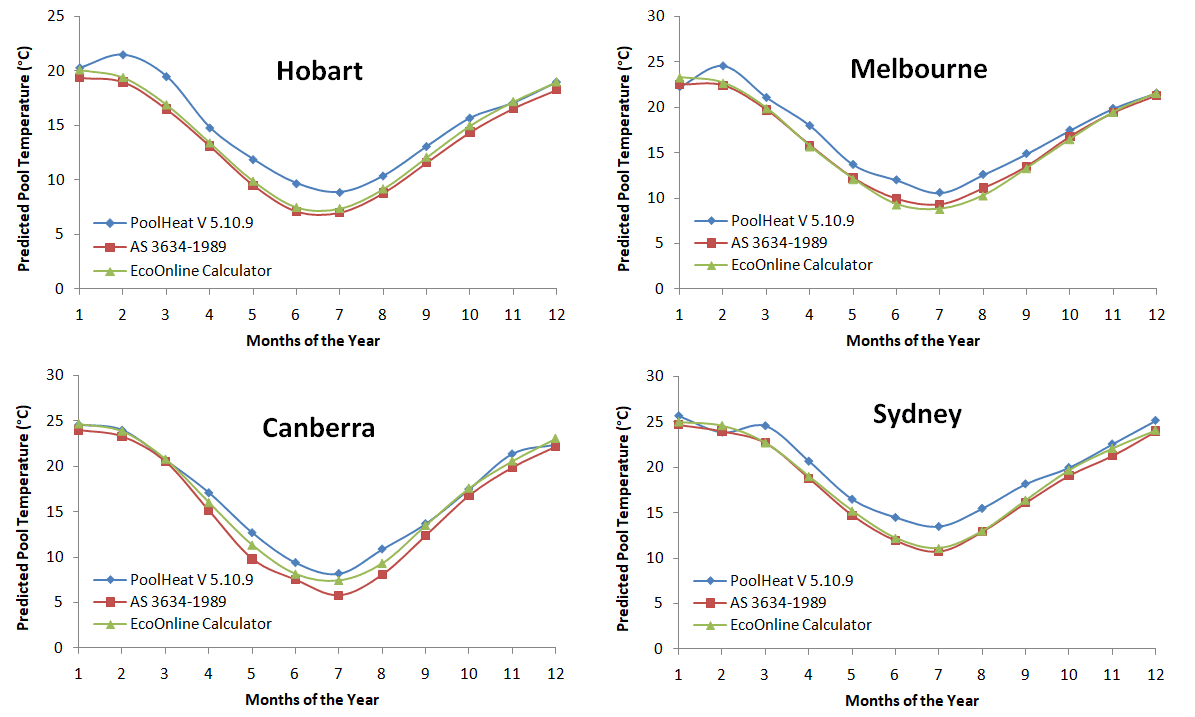
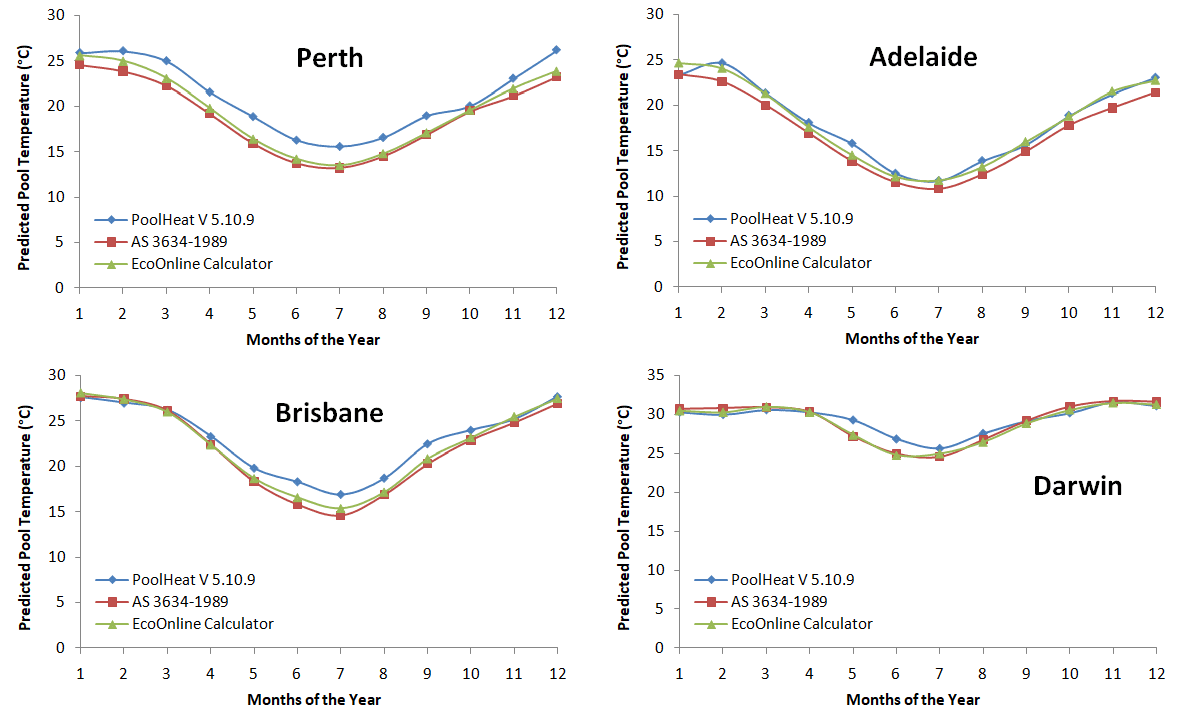
Summary: As can be seen excellent agreement is obtained overall. The EcoOnline simulator produces results closer to AS 3634-1989. This is not surprising as the two use similar solar radiation and weather data, whereas PoolHeat seems to use Perez et.al., Solar Energy, 1990 for its solar insolation database. Furthermore, ISO TR 12596 1995 uses a significantly lower evaporation loss function, while our calculator uses a literature consensus. It's reassuring to see the simulator produce results in between AS 3634-1989 and PoolHeat (ISO TR 12596 1995).
Validating Predicted Solar Bubble Blanket Cover Temperatures
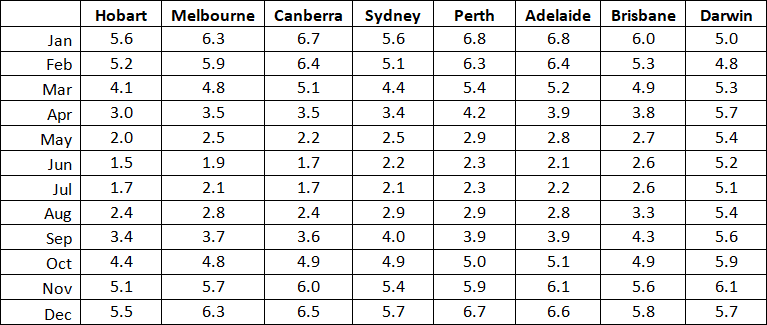
We take the pool blanket temperature data supplied by Czarnecki1 and fit the evaporation, convection, radiation loss and light transmission scaling coefficients to reproduce their results to model the effects of a pool blanket. Using updated solar insolation, weather data and the fitted loss coefficients we calculated the temperature increases when using a transparent bubble type blanket cover. The pool used was an unshaded, wind suburban sheltered, light wall color pool, covered 100% of the time (units in °C).
Summary: CSIRO stated in a Technical Report2 that transparent pool covers will increase pool temperature by a maximum of approx ~7°C, but more typical 6-5°C. This was also verified by a Rheem Research Centre study3. Hence the calculator predicts a boost in pool temperatures from pool blankets that are perfectly consistent with these reports.
Validating Predicted Solar Heater Gains
We compare our solar heating pool temperature gains to the Czarnecki study and PoolHeat (which uses results from Guthrie4) - for a black metal roof using the 8 tube collector. We used Czarnecki’s 0.7 efficiency factor for the 8 tube (down adjusted to 0.635 from the SRCC calibration described below). The 8 tube collector in our calculator has a tube to air gap (tube spacing) aperture ratio of 45% to 55%, meaning that is there is an air gap spacing the size of 1.22 diameter of a tube between the tubes. The 8 tube is a very old style collector and a close match to the tube collectors specified by Guthrie and Czarnecki in their work. Results shown are for 100% collector coverage, wind suburban sheltered, unshaded, no solar blanket, light colored walls pool:
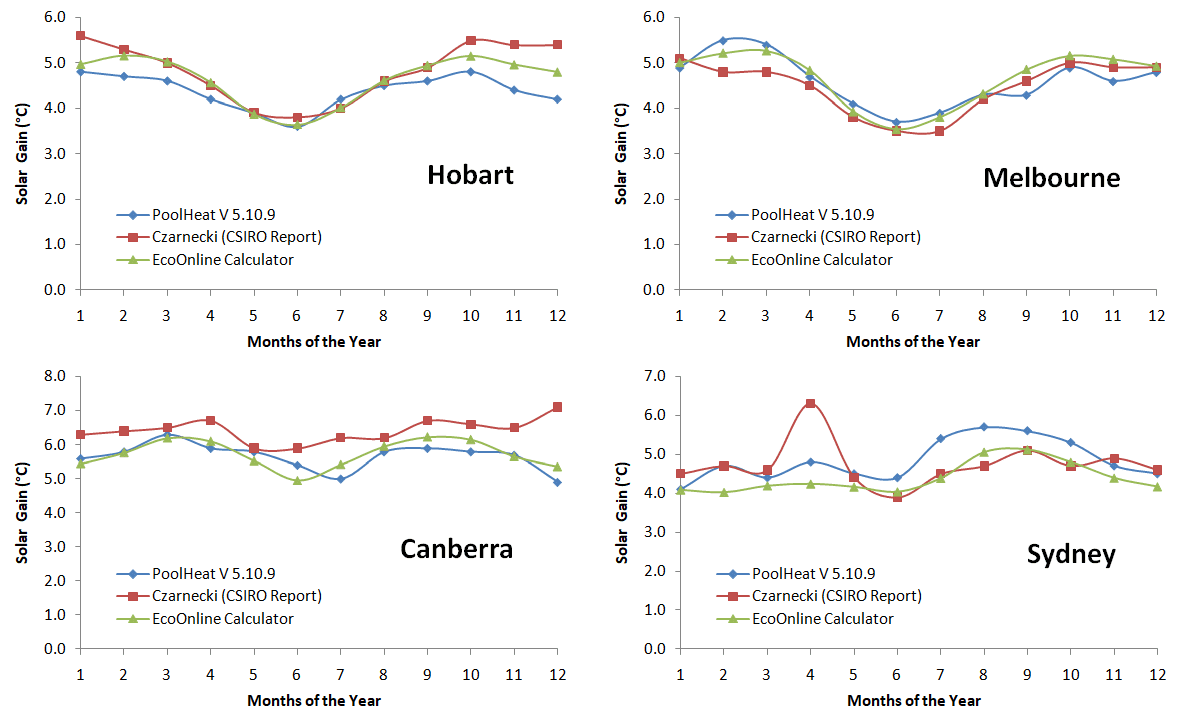
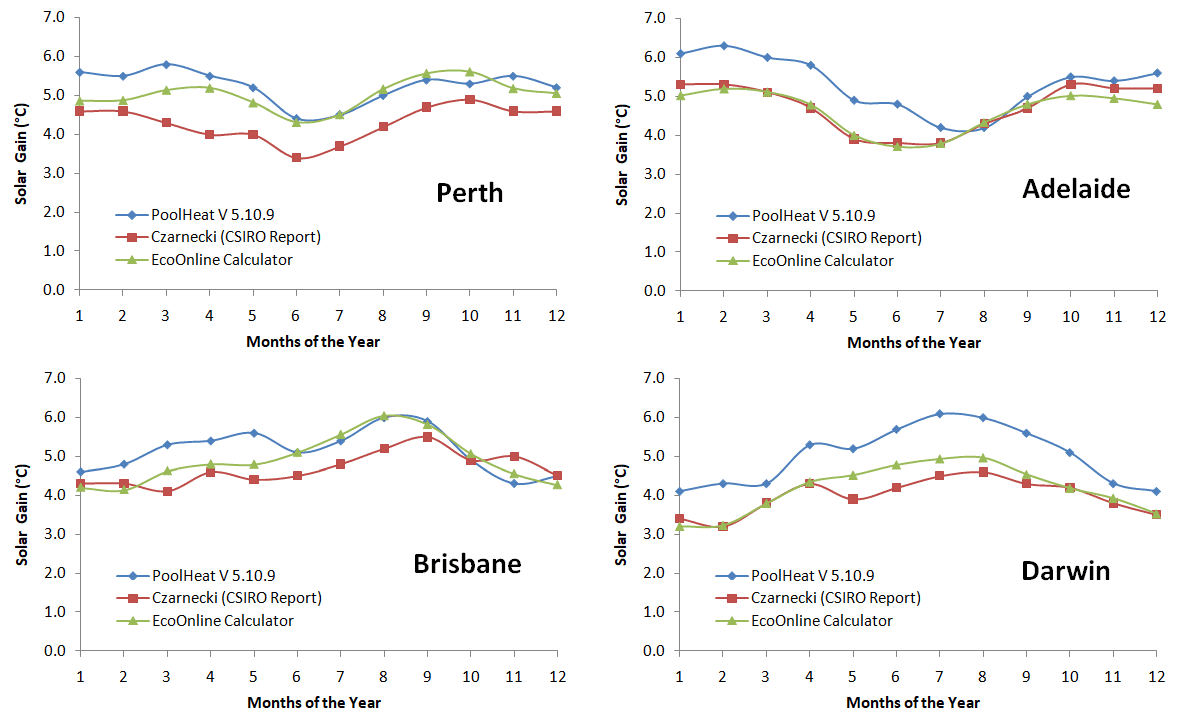
Summary: Excellent agreement is obtained considering the different data and methodologies used. Typically the calculator predicts solar boosts temperature somewhere in between PoolHeat V 5.10.9 and Czarnecki predictions. Average temperature gains across all states and all months was 5.02°C, 4.76°C and 4.77°C for PoolHeat, Czarnecki and our calculator respectively. Due to the lower evaporation rates used in PooHeat the solar boost factor is slightly higher for some states.
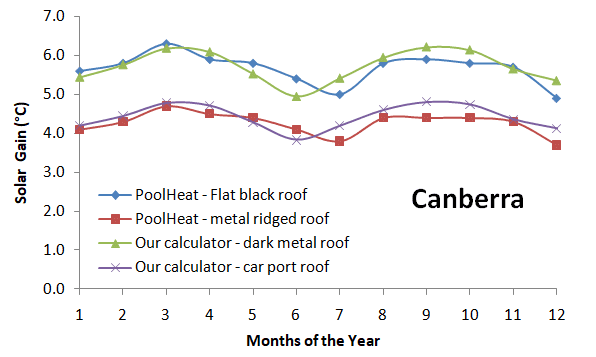
Validation of the Calculators Different Roof Scaling Factors
Secondary Validation of the Solar Heating Algorithm Using SRCC OKU Panel Testing
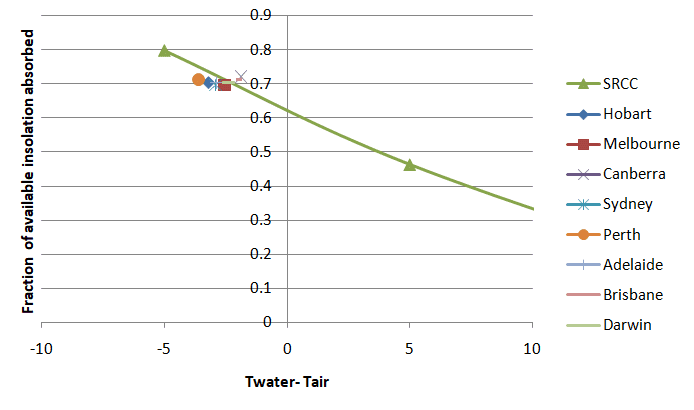
We further calibrate the solar gains using certified SRCC OKU panel efficiency results based on the ISO 9806:20135 testing standard and a neat self-consistency check as follows: We know a light colored pool absorbs 85% of the suns radiation, we also know OKU panels absorb almost the same percentage of the daily available heat from the SRCC report. By shading the pool to 100% and replacing this lost insolation with a 100% surface coverage flat pitch mounted OKU system we can obtain the predicted fractional collector absorbance from this 85% reference point and compare this to the SRCC result - calibrating the calculator as required.
However, for a direct one to one comparison, we must make the SRCC test results and calculator collector conditions as identical as possible. Firstly, the ISO 9806:2013 uses a flow rate of 1.2L/min/m2 and we know flow rates have a large influence on efficiencies,7 hence if we set the calculator to 1.5L/min/m2 we must scale up the SRCC result by 3.8%7 for a fair comparison. Secondly, the ISO 9806:2013 test used the less efficient 1000 OKU panel while the 1002 panel has 2.95% greater area and better flow distribution however we just use the 2.95% extra area correction here. Thirdly, the ISO 9806:2013 standard is designed for reproducibility and does not represent realistically mounted residential conditions. In ISO 9806:2013 collectors are mounted on an open to the air frame at 30° with the back fully exposed to air flow. Conservatively, OKU panels mounted on a roof substrate, we approximate would experience approximately 50% lower wind speeds on the back, hence the wind coefficient can be scaled by 75%. Across a representative section of the efficiency curve, this equates to ~5% extra efficiency which can also be added to the SRCC result.
Setting the calculator to 100% shaded, with 100% OKU panel coverage, mounted flat on a carport roof - as this roof structure does not contain any roof latent heat back absorption correction same as the ISO 9806:2013 conditions (only the backside wind correction described above) we can now use the SRCC line as a calibration point. After calibrating, the average absorbed was fraction 70.6% while the SRCC result came in at 71.4%. We found we only needed to scale down our collector by a minor 6.5% to get this result, showing the correctness of the previous fit to Czarnecki for the lower efficiency 8 tube collectors and our efficiency scaling relationship between OKU panels and 8 tube. The chart shows a comparison of the fraction of available insolation absorbed by OKU panels from our calculator all states and that determined by the SRCC OKU panel report for identical conditions.
Validation of Auxiliary Heater Calculations
To sample all months we calculate the gas heating cost required to maintain a typical an unshaded, no blanket, suburban sheltered 32m2 pool with light pool wall color, heated year-round to 29°C (33°C for Darwin) using a gas price of 2.3c/MJ. We then compare the results to PoolHeat and AS 3634-1989. It's important also explore all extremes, hence we also calculated gas heating costs for a warm and cold pool. For a warm pool we set both simulations to wind "sheltered" and used a pool wall color set to "dark". For the cold pool we used a light colored pool wall with full wind exposure and 100% shading.
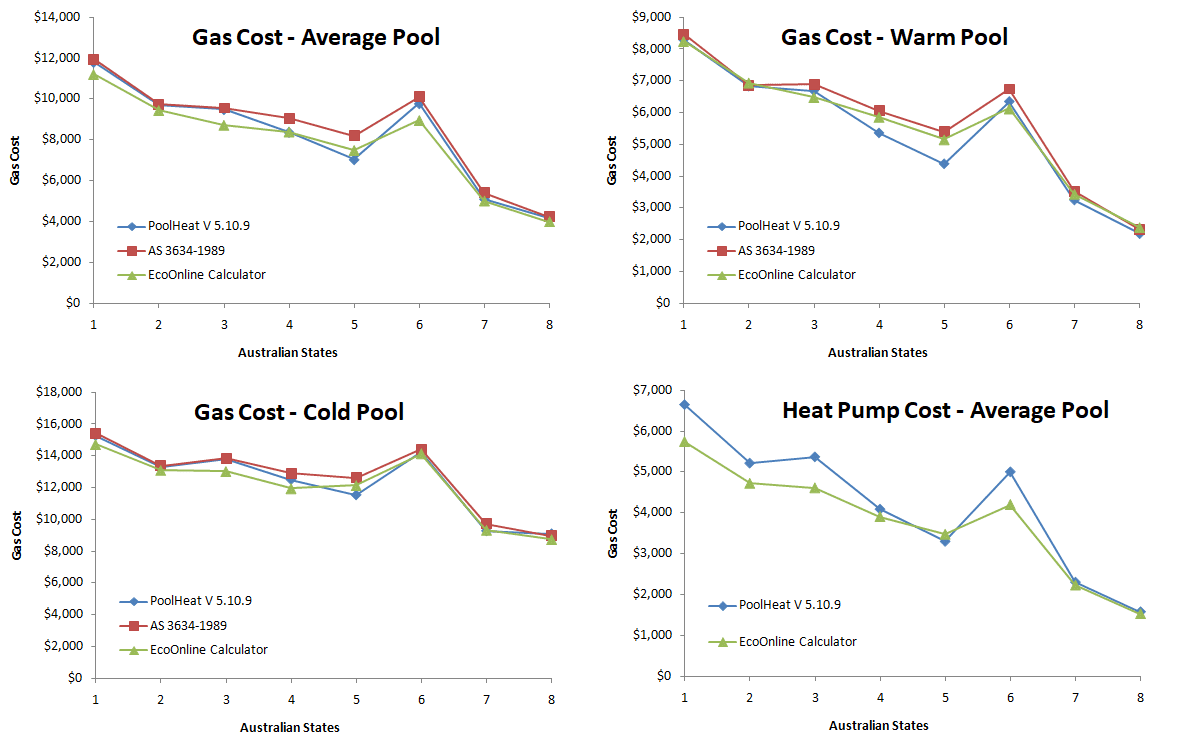
Capitals are enumerated as follows: Hobart (1), Melbourne (2), Canberra (3), Sydney (4), Perth (5), Adelaide (6), Brisbane (7), Darwin (8). Note: PoolHeat does not constrain pool temperatures exactly to 29°C, so we had to set the calculator's monthly desired temperatures to that used by PoolHeat for an accurate comparison. Heat pump COP AHRI8 factors used for the heat pump calculations shown were HAHH, HAMH, LAMH: 5.79, 5.54 and 3.999 respectively. This corresponds to a PoolHeat COP at test conditions 20/25°C of 4.98 with a temperature variation of 0.091. Electricity rate was 0.230 $/kWh.
Summary: Excellent agreement is found overall. However, we find PoolHeat does not include a humidity correction in the heat pump calculations, while we include such a correction, leading to our calculator predicting lower heating cost for heat pump for the capitals Hobart, Canberra and Adelaide by 15% and Melbourne by 10% as these capitals have high daytime humidity in winter at approx 60-70%, this improved the COP factors in our calculator over the simple COP factor variation temperature scaling function used by PooHeat.
Validation of East/West Mounted Solar Collector Corrections
East mounted collectors work at lower efficiency to west mounted collectors, as shown in the AS 3634-1989 Standard optimal collector orientation charts. It’s important to model this. The calculator takes into consideration the following:
- Solar Insolation differences between East and West mounted collector (typically East is better)
- Warmer afternoon air temperatures for West mounted collector
- Higher afternoon wind speeds (typical for most capitals)
- Latent afternoon roof warmth (especially for dark roofs, negligible for carports)
The calculator uses the above data to work out East and West mounted collector efficiency curves to find a scaling correction.
It’s difficult to validate East/West corrections, as AS 3634-1989 is lacking in the exact methodology used in arriving at the given charts, however, the general observation that west mounted roofs are better, is recovered using the corrections we implement. If it was just based on insulation data only then generally East would have shown greater efficiencies, which is the opposite of what’s observed. Only optimal collector charts for Melbourne, Perth, Sydney, and Darwin are given in the standard so we only compare to these (black and white contour charts are from AS 3634-1989). Note: the roof type is set to carport for the charts that follow.
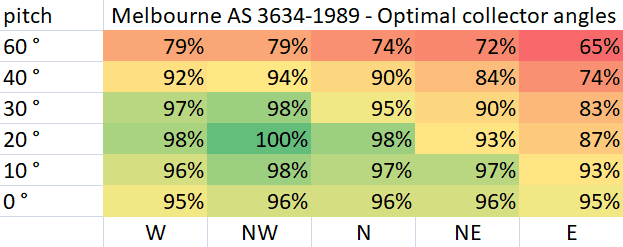
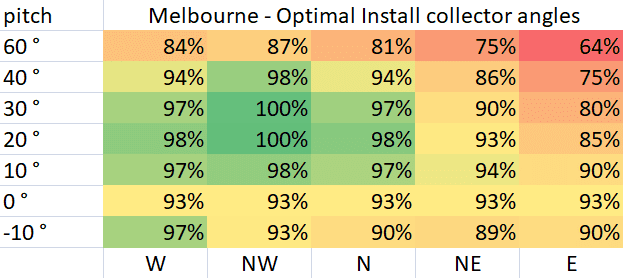
As can be seen, the simulator reproduces Melbourne's clear skew in the optimal mounting direction toward the NW with an optimal pitch around 25°, in good agreement with the AS 3634-1989 Melbourne chart.
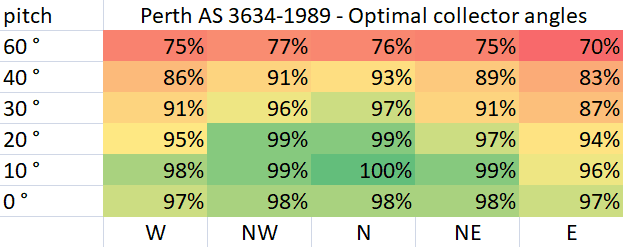
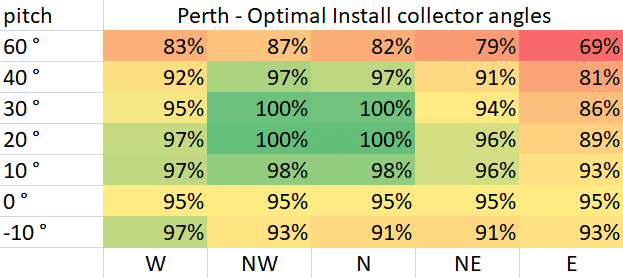
As can be seen, the simulator reproduces Perth's broads range of acceptable mounting directions with a small skew toward the NW however with an optimal pitch around 23° in good agreement with the AS 3634-1989 Perth chart.
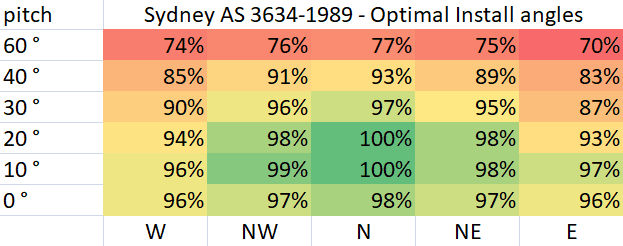
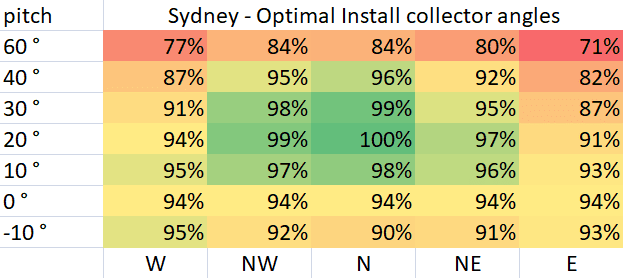
As can be seen, the simulator reproduces Sydney's broads range of acceptable mounting directions with a small skew toward the NW however with an optimal pitch around 21° in good agreement with the AS 3634-1989 Perth chart.
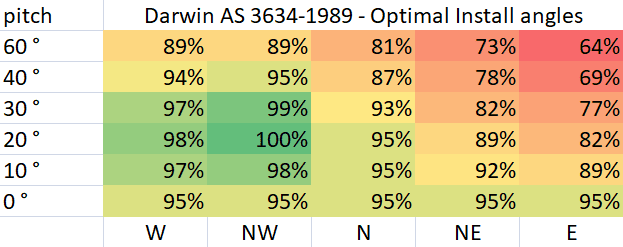
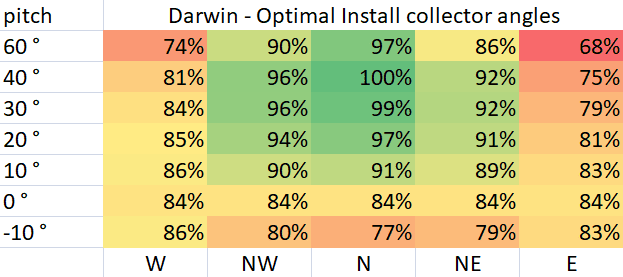
The Darwin comparison however, fails to reproduce the large skew to the NW and also show that the optimal pitch is closer to 39° which is in disagreement with the AS 3634-1989 Darwin chart. It should be noted, the updated insolation data we used for Darwin in our simulator had a very strong skew toward an East preference, but this was balanced by a strong preference toward the West from weather data. As such the calculator predicted only a very small NW preference. The insolation data has been updated a few times since AS 3634-1989 come out, so we’re not sure what insolation data was used in AS 3634-1989, or if it showed such a strong East insolation data. We can note Perez et.al., Solar Energy, 1990, which is a NASA database showed an even stronger insolation East preference. Hence, our result is not necessarily incorrect.
Summary: Apart from Darwin, overall there is excellent agreement in the East/West corrections for a calculator that uses scaling function corrections derived from representative efficiency curves from average 9am and 3pm weather data, and considering there is little information about how the AS 3634-1989 optimal install angle charts were produced and what constraints were used.
Summary
Overall we've spent a great deal of time testing and validating this EcoOnline simulator and find excellent agreement with AS 3634-1989 predictions and good agreement to PoolHeat V 5.10.9, considering the differences in data and loss functions used for all three methodologies. One area of disagreement lies in heat pump costs for year-round heating, where our simulator will predict lower heating costs for the capitals Hobart, Canberra and Adelaide by 15% and Melbourne by 10% as compared to PoolHeat V 5.10.9. We tracked this down to the fact that PoolHeat does not includes high humidity corrections which boost COP factors for heat pumps. Darwin East/West optimal mounting directions are also different from AS 3634-1989, however we are not sure when the large solar insolation preference toward the East was introduced into the Australian Solar Radiation Handbook. Further the NASA solar insolation database (based on Perez et.al., Solar Energy, 1990) showed an even stronger insolation East preference so our result maybe the more correct result and AS 3634-1989 may need to be updated.
References
- Czarnecki J.T. Swimming Pool Heating by Solar Energy , CSIRO Division of Mechanical Engineering, Technical Report No.TR19, 1978.
- CSIRO Division of Mechanical Engineering Technical Report No 12/1/3, 1977
- (1980) Rheem Research Centre, Pool Temperature Records Sealed Air Corporation, Solar Pool Blanket, John F Zaccaro & Associates
- "Testing of Solar Swimming Pool Heaters", Phase 1, by K.I. Guthrie, Victorian Solar Energy Council, report 237-P2/2/84-KG, September, 1984.
- ISO/FDIS 9806:2013 Solar energy — Solar thermal collectors — Test methods
- Test reports from Solar Ratings and Certifications Corporation(SRCC)
- L.N. Cunio, A.B. Sproul, Solar Energy, 86, p1511-17 (2012)
- ANSI/AHRI Standard 1160
- https://www.ahridirectory.org
